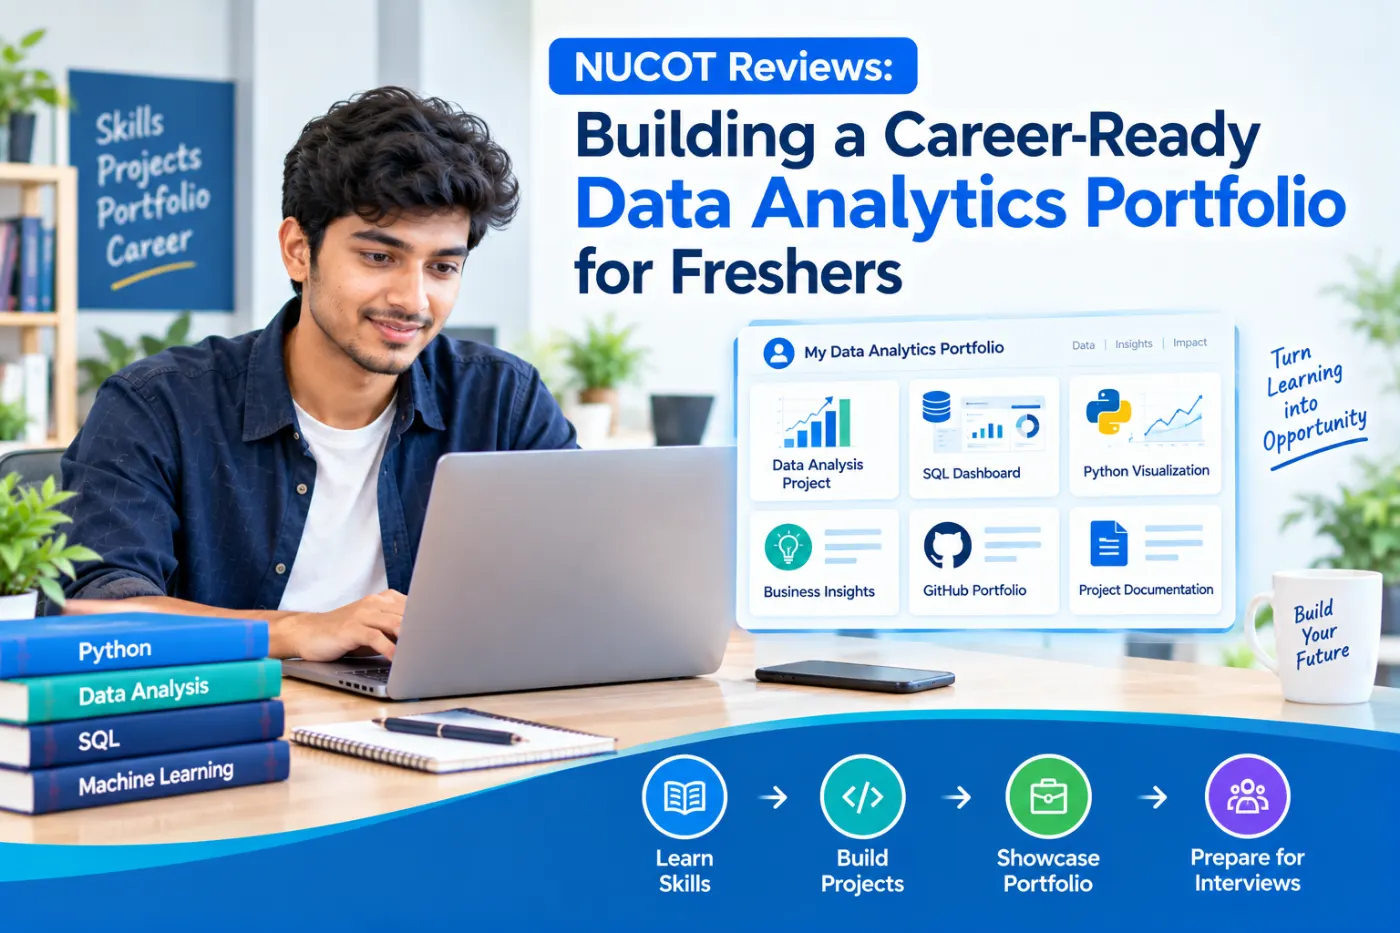
Starting a career in data analytics can feel challenging for fresh graduates. Many learners understand programming concepts and analytical methods but find it difficult to demonstrate how they would apply those skills to business problems. A well-organised portfolio can help bridge this gap by presenting practical work, explaining the reasoning behind decisions and showing how technical knowledge can be used to answer meaningful questions.
A portfolio is more than a collection of charts or programming files. It tells the story of how a learner approached a problem, prepared information, selected appropriate methods and communicated the results. It can also help learners identify areas where they need additional practice before applying for jobs.
Students researching training providers through searches such as NUCOT Reviews may also want to understand what practical learning should look like. Examining portfolio development, project quality and interview preparation provides a useful starting point for evaluating a Data Science learning pathway.
Why Is a Data Analytics Portfolio Important?
A resume usually summarises education, skills, certifications and experience. A portfolio provides examples that support those claims.
For instance, writing “Python” in a resume indicates familiarity with the tool, but a project that uses Python to clean a dataset and analyse sales trends demonstrates how that knowledge was applied. Similarly, a dashboard can show whether a learner understands how to organise information and communicate insights clearly.
A strong portfolio may help recruiters and interviewers assess several capabilities:
- Technical knowledge of Python, SQL and visualisation tools.
- Problem-solving and analytical thinking.
- Understanding of data quality and preparation.
- Ability to explain findings in clear language.
- Awareness of limitations and assumptions.
A portfolio does not guarantee an interview or a job offer. However, it gives candidates concrete examples to discuss during technical assessments and interviews.
Five Projects Freshers Can Include in Their Portfolio
1. Retail Sales Analysis Using Python
Retail sales analysis is a useful beginner project because the business questions are easy to understand. A learner can work with a suitable public dataset containing product categories, transaction dates, quantities, prices and regional information.
The first step is to inspect the dataset for missing values, duplicate records and inconsistent formats. Python libraries such as Pandas and NumPy can help organise the information and perform calculations.
The learner can then examine monthly revenue, product performance, regional differences and seasonal patterns. Charts can make these findings easier to understand.
The final project should explain the original question, the cleaning process, the analysis performed and the findings. It should also distinguish observations from assumptions. For example, a decline in sales may be visible in the dataset, but identifying its cause requires additional evidence.
2. Customer Segmentation Using Data Analysis
Customer segmentation explores how customers differ according to characteristics such as purchase frequency, transaction value or recency of purchases.
A learner can use a public or appropriately anonymised dataset to group customers based on selected measures. More advanced versions may introduce clustering methods, but beginners can start with descriptive statistics and simple comparisons.
The project should explain why particular variables were selected and what the resulting groups represent. It should avoid claiming that a statistical group automatically describes a person’s preferences or behaviour accurately.
This project demonstrates analytical thinking and introduces learners to the relationship between customer information and business decisions.
3. SQL-Based Business Reporting
SQL is an important skill for retrieving information from relational databases. A portfolio project built around SQL can demonstrate how a candidate filters, joins and summarises data.
For example, a learner can create or use a sample database containing customers, orders, products and transactions. Queries can answer questions such as which product categories generate the highest revenue, which months have the most orders and how sales vary across regions.
The project should include readable SQL queries, explanations of the joins and aggregations used, and a short summary of the results.
This is particularly useful for candidates applying for data analyst, reporting analyst and business intelligence roles, where working with structured data is a common responsibility.
4. Interactive Dashboard With Power BI or Tableau
Dashboards help users explore key performance indicators without manually reviewing large tables. A learner can build a sales, operations or customer-service dashboard using Power BI or Tableau.
A useful dashboard might contain revenue trends, category comparisons, regional performance and filters that allow users to explore specific periods or segments.
The goal should be clarity rather than visual complexity. Each chart should answer a business question, and the labels should be understandable to a non-technical audience.
The project description can explain the intended audience, the metrics selected and the decisions the dashboard could support. It should also disclose the source and limitations of the data.
5. Introductory Machine Learning Project
Once the fundamentals are established, learners can attempt an introductory machine learning project. Examples include estimating house prices, predicting customer churn using a suitable dataset or classifying product reviews.
The learner should divide the data appropriately into training and evaluation sets, choose a suitable metric and explain why that metric matters. They should also compare model results against a simple baseline where appropriate.
A machine learning project is not automatically stronger than a well-executed SQL or dashboard project. The most valuable project is one that the learner understands and can explain confidently.
How to Present Projects Professionally
Explain the Business Problem First
Start each project with a clear question. Instead of saying “I created a Python project,” explain what the analysis was designed to investigate.
A project summary might state that the objective was to identify monthly sales trends and compare product performance. This gives readers a reason to examine the methods and results.
Document the Complete Process
A good project explains the steps from raw information to final findings. Include data preparation, assumptions, calculations, tools and evaluation methods.
Where possible, provide a README file, organised code, relevant screenshots and a concise conclusion. Keep file names clear and remove unnecessary temporary files.
Share Work Responsibly
Learners can use GitHub or another appropriate portfolio platform to organise code and documentation. Dashboards may be shared through suitable publishing options, subject to the platform’s terms and data permissions.
Never publish confidential employer information, personal customer data, passwords or private access credentials. Use public datasets, synthetic data or properly anonymised information when building demonstrations.
Practise Explaining the Results
A project should be understandable without requiring the reviewer to run every line of code. Prepare a short explanation covering the question, approach, findings and limitations.
Interviewers may ask why a particular method was selected, what alternative approaches were considered or what additional information would improve the analysis. Being able to discuss these questions is often more valuable than presenting a complicated project without understanding it.
How Training Can Support Portfolio Development
A structured learning program can help beginners progress from fundamental concepts to practical applications. However, learners should evaluate the actual project work and support available rather than judging a program only by its title or advertised tools.
When comparing a Data Science course in Bangalore or a Data Science training institute in Bangalore, consider whether the syllabus covers Python, SQL, statistics, data cleaning, visualisation and appropriate introductory machine learning. Ask how projects are reviewed, whether learners receive feedback and how the program helps them prepare to explain their work.
NUCOT provides training in Data Science and related technology areas. Prospective learners can review the current curriculum and program conditions on the NUCOT Data Science and Data Analytics training page.
Before enrolling, confirm the current fees, duration, delivery format, project expectations and scope of placement assistance directly with the provider. Training and career support should not be confused with a guaranteed job offer.
Understanding NUCOT Reviews When Comparing Training Options
Searching for NUCOT Reviews can be part of the research process, but online opinions should be considered alongside practical evidence. Prospective learners can compare published course details, ask questions about projects and evaluate whether the teaching approach suits their starting level.
Reviews may describe different experiences because learners have different backgrounds, expectations and learning requirements. If feedback raises a concern, investigate the specific issue and look for current, verifiable information rather than relying on a single comment.
It is also helpful to ask whether a program provides meaningful practice, feedback on assignments and opportunities to build a portfolio. These details can help learners assess how a course aligns with their personal goals.
Conclusion
A career-ready data analytics portfolio demonstrates more than familiarity with technical tools. It shows how a learner approaches questions, prepares information, analyses results and communicates conclusions.
Freshers can begin with retail analysis, SQL reporting and dashboards before moving to customer segmentation or introductory machine learning. Clear documentation, responsible data handling and the ability to explain project decisions make these examples more useful.
For anyone researching NUCOT Reviews or comparing Data Science training options, the best approach is to evaluate the curriculum, practical assignments and career-support terms carefully. Building a portfolio takes time and consistent practice, but it gives learners a structured way to demonstrate their progress and prepare for technical interviews.