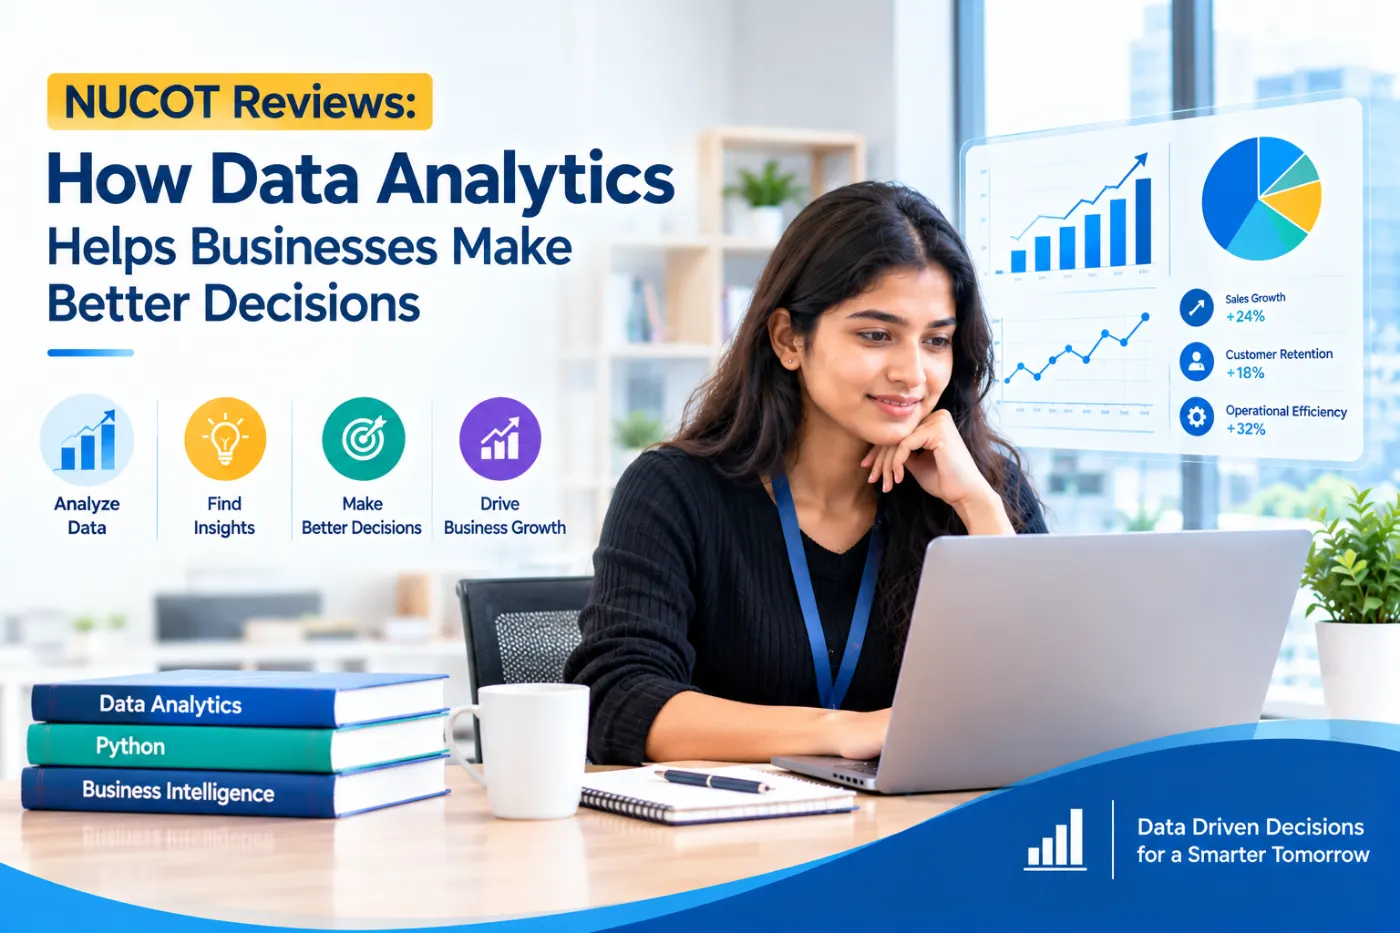
Businesses generate large amounts of information every day. Sales transactions, customer enquiries, website visits, marketing campaigns, inventory records and operational reports all contain information that can help organisations understand their performance. However, collecting information is only the first step. The real value comes from analysing it and using the findings to make better business decisions.
This is where data analytics plays an important role. By organising information, identifying patterns and presenting results through reports and dashboards, businesses can make decisions based on evidence rather than assumptions. These capabilities are useful across industries, including retail, healthcare, finance, manufacturing, education and information technology.
People researching technology companies, training providers and terms such as NUCOT Reviews may also be interested in understanding how practical data skills connect with business requirements. Exploring real business applications can help prospective learners understand why Python, SQL, statistics, data visualisation and analytical thinking are important in today’s technology landscape.
What Is Data Analytics and Why Does It Matter?
Data analytics is the process of examining information to identify trends, answer questions and support decisions. It involves collecting relevant data, checking its quality, organising it, analysing patterns and communicating the findings.
Consider a retail business experiencing a decline in monthly sales. Management might initially assume that the problem is caused by higher prices or increased competition. However, an analysis of sales records could reveal that a particular product category has lost customers, several locations have experienced stock shortages, or a marketing campaign is attracting website visitors without generating purchases.
These findings help the business investigate the actual causes of the problem and decide what to do next.
Data analytics can support several business objectives, including improving customer experience, reducing unnecessary costs, measuring marketing performance, managing inventory and identifying new opportunities. It does not remove uncertainty from every decision, but it gives decision-makers a stronger foundation for evaluating their options.
How Businesses Use Data to Improve Performance
1. Understanding Customer Behaviour
Customers interact with businesses through websites, applications, physical stores, customer support teams and social media. Each interaction can provide information about their preferences, concerns and purchasing behaviour.
Businesses can analyse this information to identify frequently purchased products, popular services, common customer complaints and reasons for abandoned transactions. Marketing teams can also compare campaign performance to understand which channels generate meaningful engagement.
For example, an online retailer may discover that many customers add products to their shopping carts but leave before completing a purchase. Further investigation might reveal unexpected delivery charges, a complicated checkout process or limited payment options.
The business can then test changes and measure whether the completion rate improves.
Customer data must be collected and handled responsibly, with appropriate privacy protections and access controls. The goal is to understand customer needs without compromising trust.
2. Improving Sales and Marketing Decisions
Sales and marketing teams often work with multiple reports, campaign metrics and customer segments. Without a consistent analytical process, it can be difficult to understand which activities are producing results.
Data analytics allows teams to compare revenue, conversion rates, customer acquisition costs and campaign performance. Instead of measuring success only through website traffic or social media engagement, businesses can evaluate whether their activities contribute to meaningful outcomes.
For instance, a company may find that one advertising campaign attracts a large audience but produces few enquiries, while another reaches fewer people but generates more qualified leads. This information can help the marketing team review its budget allocation and campaign strategy.
Tools such as spreadsheets, SQL databases and business intelligence dashboards make it easier to organise these metrics. Python can be useful when analysts need to clean larger datasets, automate repetitive reports or perform more detailed analysis.
3. Managing Costs and Operational Efficiency
Operational decisions often involve balancing cost, quality, speed and customer expectations. Data analytics can help organisations understand where delays occur, which processes consume the most resources and where improvements may be possible.
A manufacturing company, for example, can compare production schedules, equipment downtime and defect rates. A logistics business can analyse delivery times and route performance. A service organisation can examine how long it takes to resolve customer requests.
These insights can help managers identify bottlenecks and prioritise improvements.
However, data should be interpreted in context. A higher operating cost does not automatically indicate poor performance. It may reflect seasonal demand, investment in quality or a temporary increase in workload. Good analysis combines numerical findings with operational knowledge before recommending action.
4. Forecasting Demand and Planning Inventory
Businesses need to anticipate future demand to manage stock, staffing and purchasing. Ordering too much inventory can increase storage costs and waste, while ordering too little can lead to missed sales and dissatisfied customers.
Historical sales, seasonal patterns, promotions and other relevant factors can be used to estimate future demand. Statistical methods and machine learning models may help identify patterns that are difficult to detect through manual inspection.
For example, a retailer can compare sales across different months to determine which products experience predictable seasonal increases. The business can use this information to plan inventory and staffing more effectively.
Forecasts are not guarantees. Unexpected events, changing customer preferences and market conditions can make predictions inaccurate. Businesses should therefore monitor actual performance, review assumptions and update forecasts as new information becomes available.
Essential Tools Used in Business Data Analytics
Different tools serve different purposes. The right combination depends on the size of the dataset, the business question and the complexity of the analysis.
Python for Data Preparation and Analysis
Python is widely used for data cleaning, analysis, automation and machine learning. Libraries such as Pandas and NumPy help analysts manipulate structured data, perform calculations and prepare datasets for further investigation.
For example, a sales analyst can use Python to combine monthly files, standardise date formats, identify missing values and calculate revenue by product category. Automating these steps can reduce repetitive manual work and make reporting processes easier to reproduce.
Learning Python involves more than memorising syntax. Analysts need to understand variables, data structures, functions, logical operations and how to interpret results.
SQL for Working With Databases
SQL, or Structured Query Language, is used to retrieve and manipulate information stored in relational databases. It is particularly useful when businesses maintain large collections of customer, sales, inventory or transaction records.
An analyst may use SQL to filter transactions by date, group revenue by region, compare product categories or join information from multiple tables.
Understanding joins, aggregation, filtering and subqueries helps analysts answer business questions efficiently. SQL is therefore an important skill for many entry-level data analyst and business intelligence roles.
Power BI and Tableau for Visualisation
Data visualisation helps people understand results without having to read lengthy tables of numbers. Tools such as Power BI and Tableau allow analysts to create dashboards, charts and interactive reports.
A sales dashboard might display revenue trends, regional performance, product categories and monthly targets. Managers can use these views to identify unusual changes and ask more focused questions.
An effective dashboard should prioritise clarity. Too many charts, unnecessary colours or unclear labels can make a report difficult to interpret. Each visual should help answer a specific business question.
Statistics and Machine Learning
Statistics helps analysts distinguish meaningful patterns from random variation. Concepts such as averages, distributions, correlation, sampling and hypothesis testing are useful when comparing performance or evaluating the results of an experiment.
Machine learning can extend analysis by identifying patterns and generating predictions from historical data. Applications include customer segmentation, demand forecasting and certain types of fraud detection.
These techniques require careful evaluation. A model that performs well on historical data may not work equally well in changing conditions. Analysts should understand data quality, bias, model limitations and the consequences of acting on predictions.
A Practical Example: Turning Sales Data Into Business Insights
Imagine a small business that sells products through three regional branches. Management wants to understand why revenue has declined over the last quarter.
The analyst begins by collecting transaction records and checking for missing values, duplicate entries and inconsistent product names. SQL is used to retrieve relevant sales information, while Python supports data cleaning and calculations.
The analyst then compares revenue by month, region and product category. A dashboard presents the results so that managers can examine the differences more easily.
The analysis might reveal that overall revenue has declined mainly because one product category is frequently out of stock in a particular region. This finding gives management a specific issue to investigate instead of prompting broad changes across the entire business.
The team can review supplier delays, adjust inventory planning and monitor sales during the following weeks.
This example illustrates an important principle: useful analytics connects a business question to reliable data, clear analysis and a measurable action. The value lies not merely in creating a chart or writing code, but in helping people make a more informed decision.
Developing Data Analytics Skills for Career Growth
As organisations continue to use data in their operations, professionals who can interpret information and explain findings clearly may find opportunities across different business functions. Possible career paths include data analyst, business intelligence analyst, reporting analyst and, with additional technical knowledge and experience, data scientist.
For beginners, a structured learning path can make the subject easier to approach. A practical sequence may include spreadsheet fundamentals, SQL, Python, statistics, data cleaning, exploratory data analysis, visualisation and introductory machine learning.
Projects are particularly useful because they demonstrate how technical skills can be applied to a problem. A learner might analyse retail sales, investigate customer retention or build a dashboard that tracks business performance.
Each project should explain the problem, the dataset, the methods used, the findings and the limitations. This helps employers understand the learner’s reasoning instead of seeing only a final chart or code file.
Anyone comparing a Data Science course in Bangalore or a Data Science training institute in Bangalore should review the syllabus, practical assignments, trainer support and opportunities to build projects. The learning format should suit the learner’s current knowledge and schedule.
NUCOT offers training in areas including Data Science, Data Analytics, Python, Machine Learning and Generative AI. Prospective learners can review the current curriculum and course terms on the official NUCOT training program page. The page describes a paid upskilling program rather than a direct job opportunity, with placement assistance subject to the stated conditions.
How to Evaluate Information When Researching NUCOT Reviews
Searching for NUCOT Reviews can be one part of researching a training provider, but reviews alone cannot explain every aspect of a course or predict an individual’s career outcome.
Readers should compare multiple sources of information. Review the current syllabus, ask how practical projects are structured, confirm the training format and fees, and understand exactly what career assistance includes. If a third-party review raises a concern, treat it as a reason to investigate the specific issue rather than assuming that every claim is automatically true or false.
It is also useful to check when the information was published. Course details, delivery methods and policies can change, so current official information should be compared with older online discussions.
A balanced approach considers both favourable and critical feedback while seeking verifiable details. This helps prospective learners make decisions based on their own requirements, budget and career objectives.
Conclusion
Data analytics helps businesses transform raw information into practical insights. By combining Python, SQL, statistics, dashboards and sound business reasoning, organisations can better understand customers, monitor performance, improve operations and plan for future demand.
For learners, these applications demonstrate why data skills are relevant beyond technical departments. The ability to investigate a problem, analyse information and communicate a clear conclusion can be useful in many professional settings.
People researching NUCOT Reviews or comparing Data Science training options should look beyond promotional claims and individual opinions. Understanding the curriculum, practical learning opportunities, project expectations and career-support terms provides a stronger basis for making a decision.
Ultimately, effective data analytics and effective career planning—both depend on asking the right questions, evaluating evidence carefully and taking informed next steps.